One of the tools I’ve heard mentioned a lot in cybersecurity spaces, particularly when it comes to vulnerability management is Nessus. Nessus is a vulnerability scanner, with Nessus Essentials being their free version. It scans systems, networks, and applications to help organisations identify vulnerabilities that pose potential security risks. It’s widely used by businesses and cybersecurity professionals to ensure the security and compliance of their IT infrastructure. It’s a powerful tool, and something I’m keen to get some experience with. This tutorial I found by Josh Madakor is a perfect start, guiding viewers through a beginner level lab to using Nessus and facilitating that first hands on experience with the tool. That is what I’m going to be working through today in this post, so follow along and hope you enjoy hearing about how I went about it.
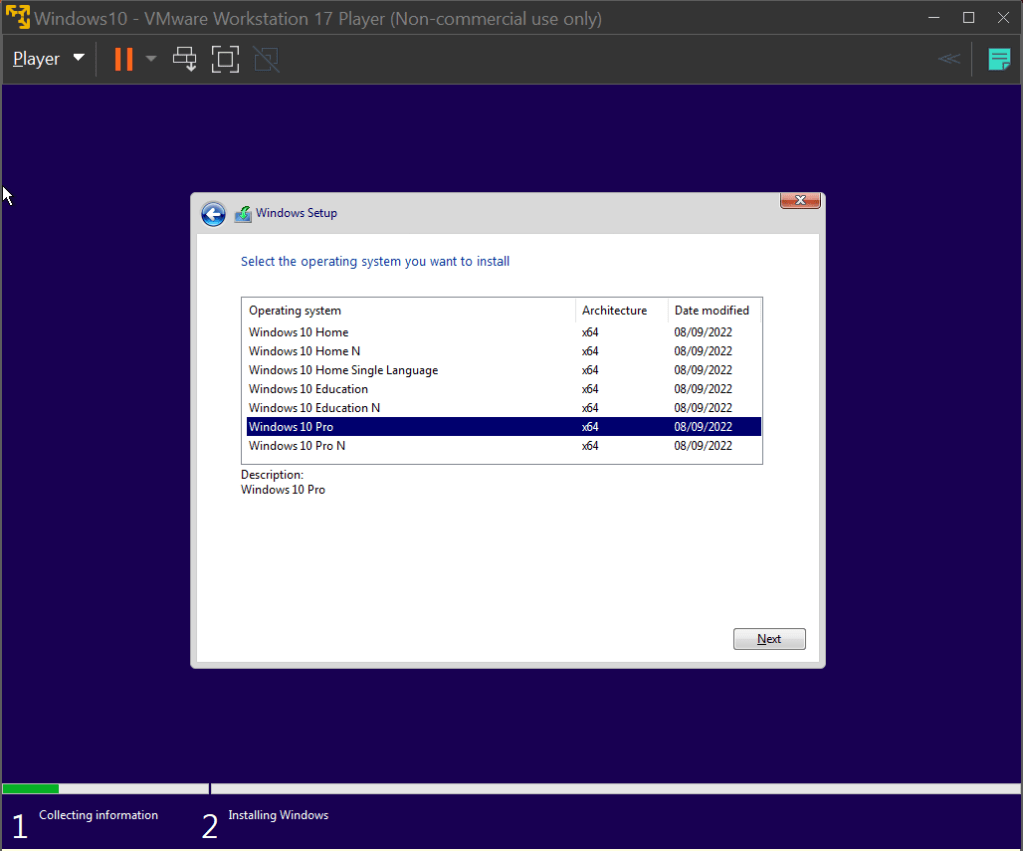
To get started, we’re going to need to download Nessus Essentials. This can be done through their website, linked here. Simple register for an activation code, follow along and it’ll download. Nessus runs on our own local machine using port 8834 by default, so we connect to the web interface by going to the URL https://localhost:8834. Simply select Nessus Essentials, punch in the activation code and it’ll download and compile the required plug-ins. We’ll be running our scans on a basic Windows 10 Virtual Machine, the ISO file for which can be found at Microsoft’s website here. I’ll be running this VM on VMware Workstation, but any alternative such as VirtualBox will do the trick as well. Download the file and create a new VM with it. We’ll be using the Windows 10 Pro operating system in this lab.
Once the VM is all set up, the first thing we’ll want to do is get the IPv4 address of the machine. We use this address to connect to the VM through Nessus Essentials that’s running on our machine. This can be done by opening the command line and typing the command ‘ipconfig’, like so:
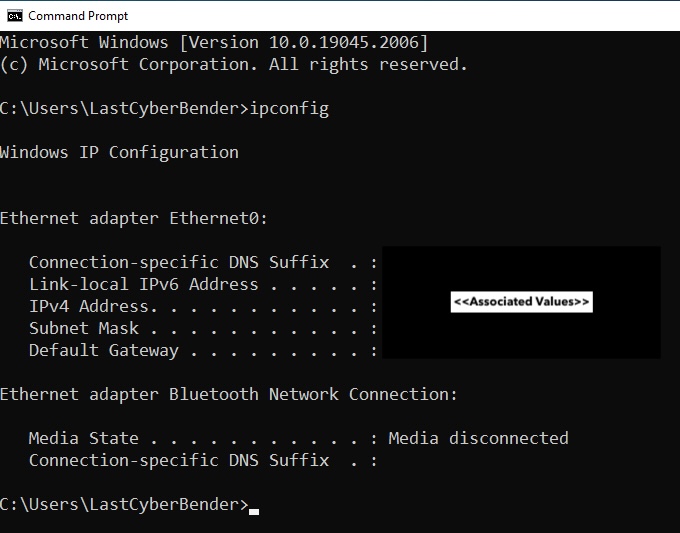
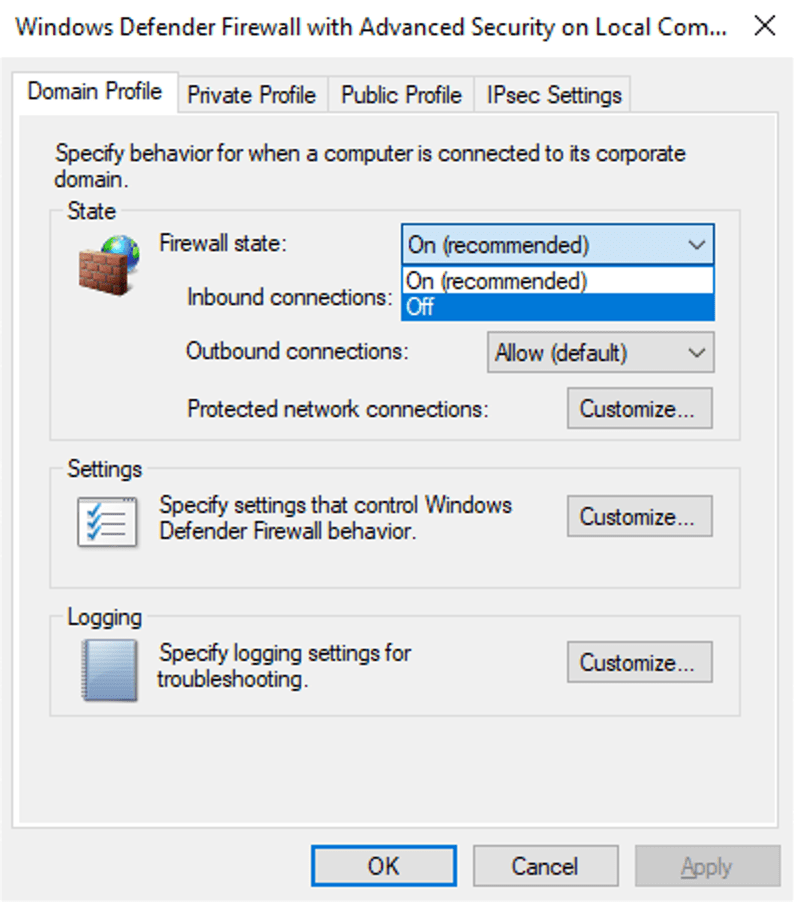
We can then ping that IP address on our PC to make sure we can reach the VM. We do this by running the command ‘ping <IPv4 address>’ on the command line. Adding the ‘-t’ flag will continue to ping the machine until we cancel it, which may be useful as our PC is most likely not going to be able to detect the VM on the first go, as the ping requests will time out. To fix this, we can just disable the firewall on the VM. When working with a proper host, this is not ideal and creates unnecessary risk. However, we’re only using this VM for this simple lab, so we don’t mind as much if we turn the firewall off. To do so, we follow the same process I did in my previous post linked here, turning the firewall state of the domain, private and public profiles off.
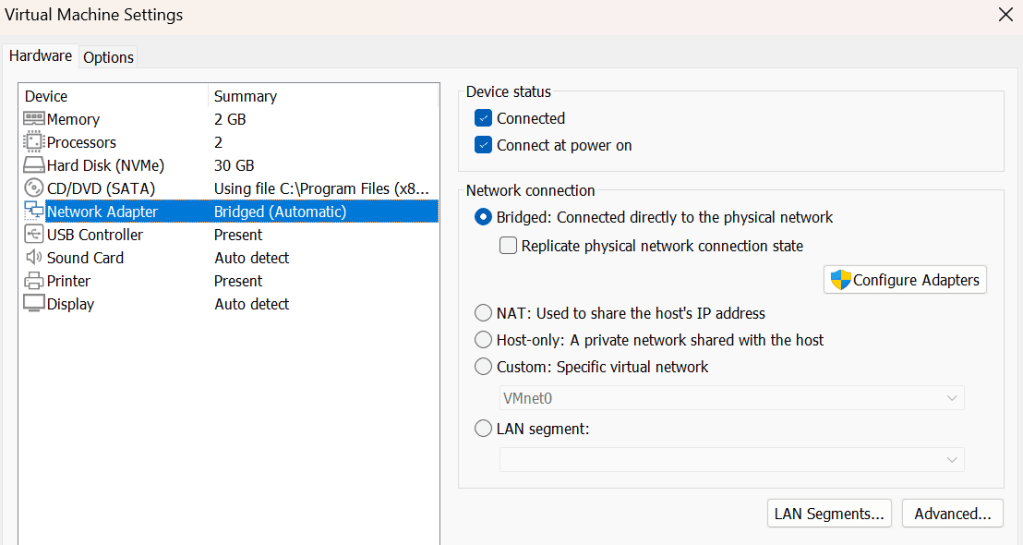
Even after disabling the firewall, I continued to not be able to ping the VM from my PC. I figured out that this was because my VM was configured to use a NAT network connection, which shared the host’s IP address. This was causing me to be unable to ping the machine, as it was on the LAN on the host. Switching the network connection to a bridged connection allowed the VM to get its own IP within the network, and made it discoverable by my PC. This can be changes in the Network Adapter tab, under Virtual Machine Settings of VMware
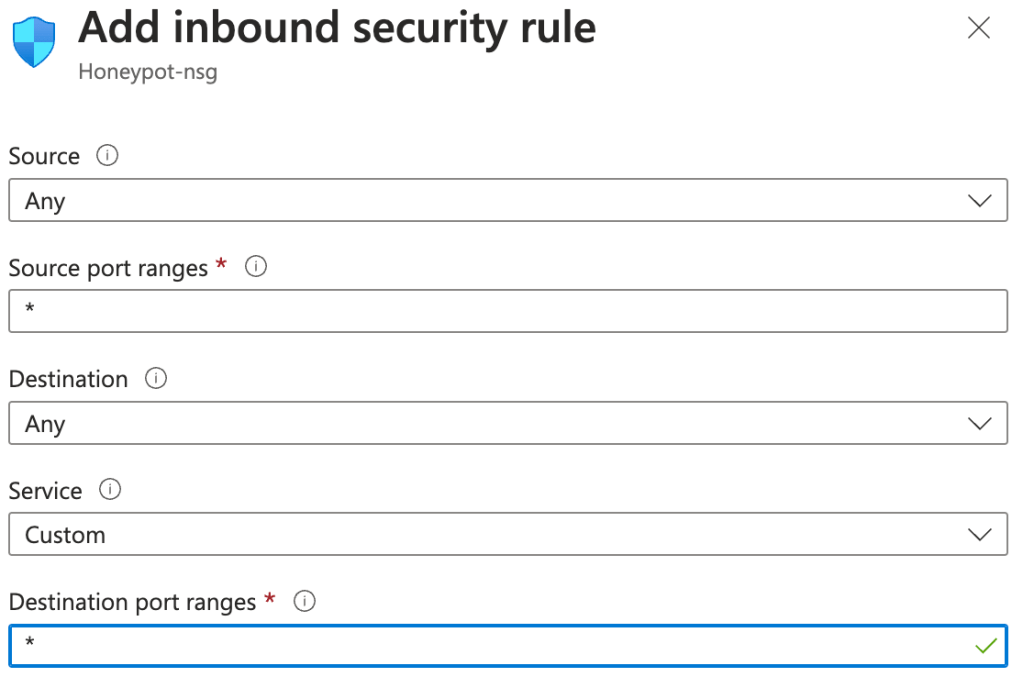
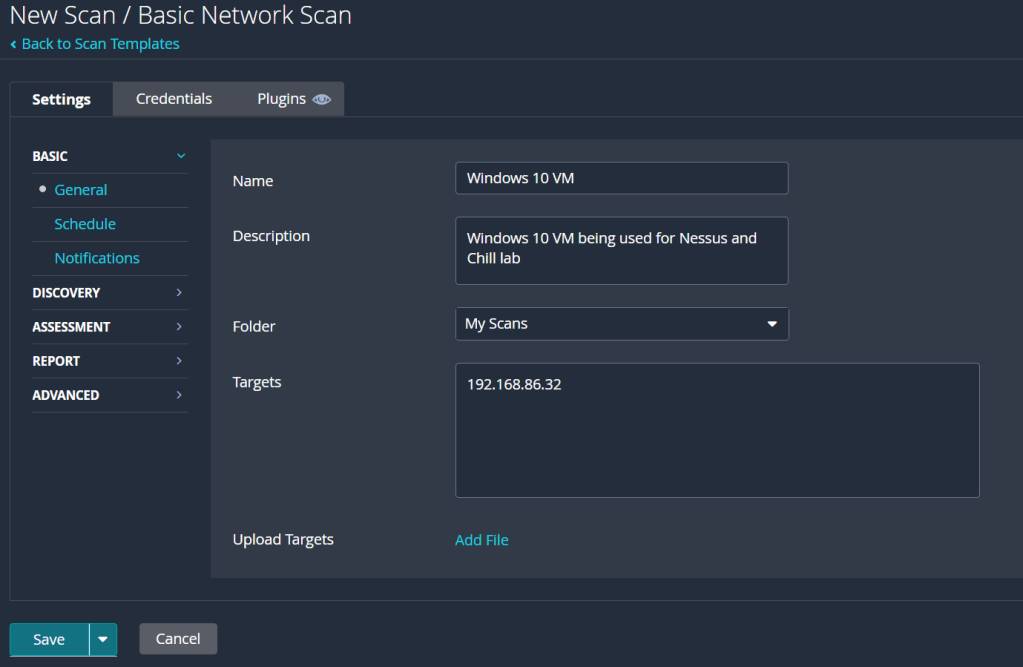
Now that we can access the VM from our PC, we can get to scanning our machine. Navigate back to our Nessus Essentials web app and create a new scan. There’s lots of different types of scans that check for a range of vulnerabilities, but we’re only going to be running a Basic Network Scan today. Click on that one and fill out the details, filling in the targets box with the IPv4 address of the VM.
The first scan we’ll be running is just a basic, non-credentialled scan. With this kind of scan, Nessus will scan the machine for any obvious vulnerabilities, reporting them back to the user along with any notable bits of information it finds about the VM. Non-credentialled scans aren’t very thorough though, as they don’t get into the machine and scan places such as the file system and registry, providing a greater assessment of the state of the machine. After our non-credentialled scan, we’ll revisit the credentials tab to run our own credentialled scan. In the meantime, we can hit save, then the launch button on the right to get the scan started.
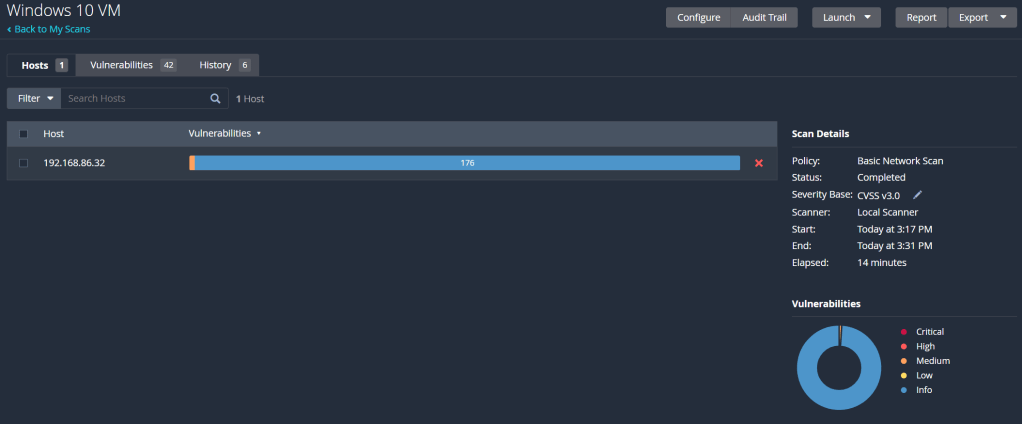
Once completed, we can click on the scan to view its results:
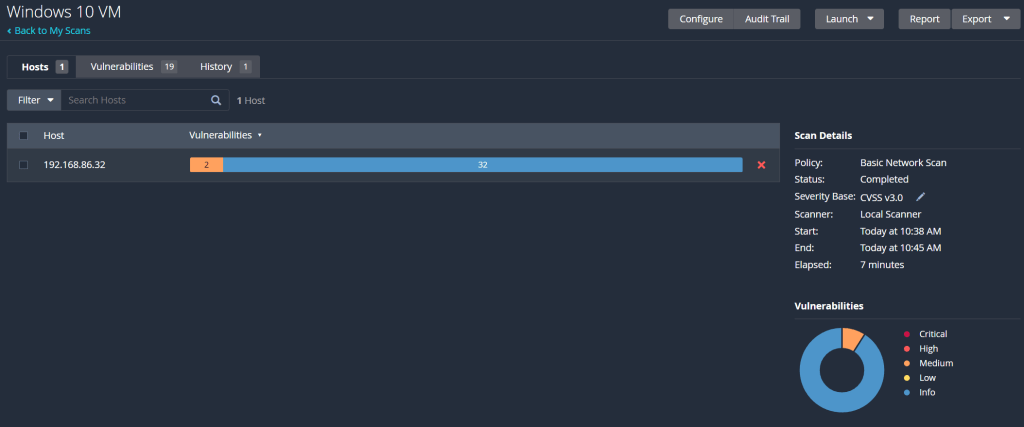
Further clicking on the scan brings up a list of all the reported vulnerabilities and information, as seen below:
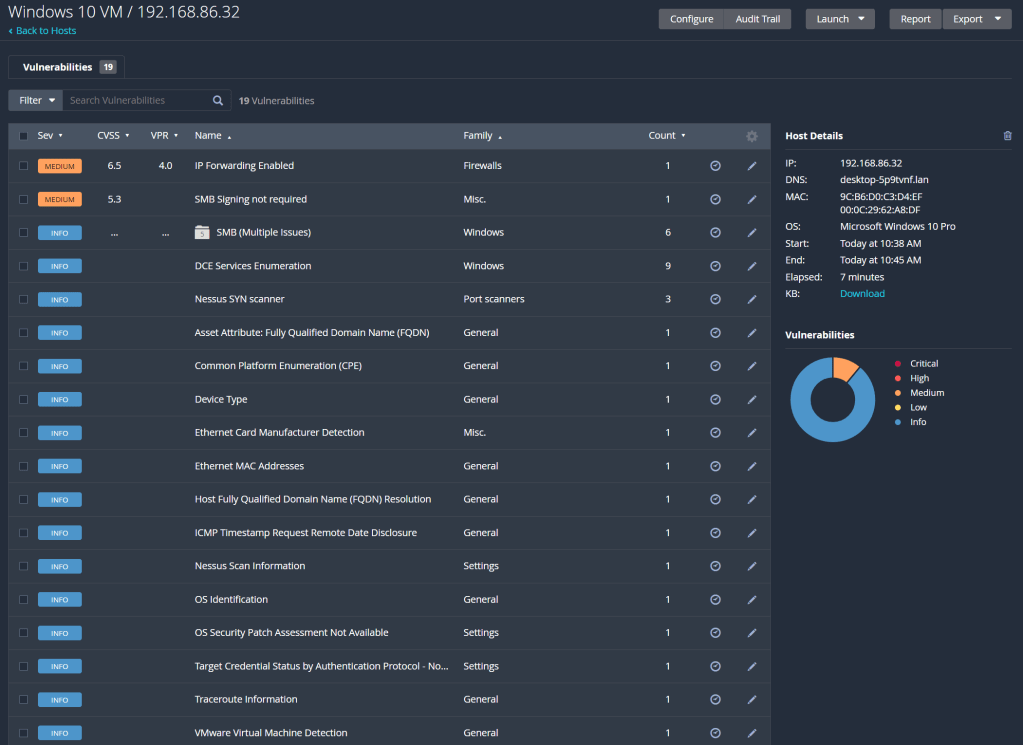
So the first scan had a couple vulnerabilities it detected but was mainly full of information about the machine. Each one of those vulnerabilities can be clicked on and expanded, to see the information reported, as well as an overview of the vulnerability detected and how to patch it. However, this scan wasn’t extensive enough for my liking, so we’re going to run a credentialed scan to identify vulnerabilities within the VM.
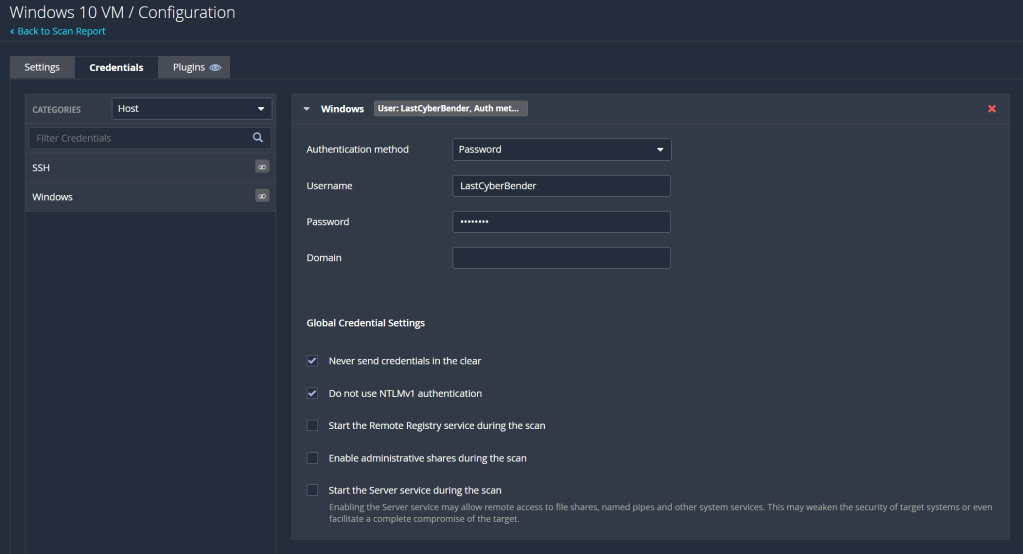
To do so, we need to configure the VM for a credentialled scan. An full walkthrough of enabling a credentialled check on Windows can be found here, which goes into better detail than I can. Essentially, we enable the remote registry, enable printer and file sharing, and disable user account control. Then we added a registry entry called LocalAccountTokenFilterPolicy, settings its value to 1. Once that is all done, reboot the VM, and we can run our credentialled scan. Return to Nessus, select the scan, and click on configure which is under the more tab in the top right of the screen. There, we add a new set of windows credentials under the credentials tab, inputting our username and password.
Save it and we can run the scan one more time. Once it’s complete, it should be looking something like this:
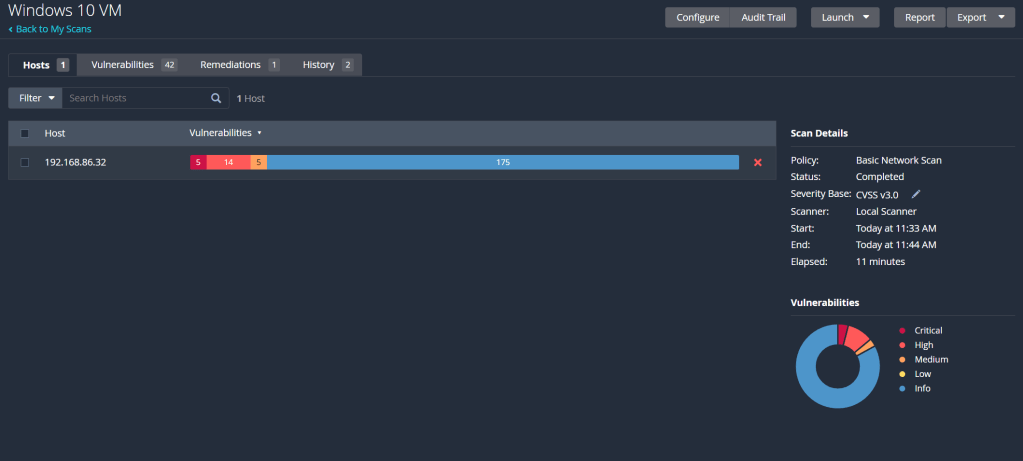
That’s a lot better. Now we can see that even as a default Windows 10 machine, there’s multiple vulnerabilities present right off the bat. To simulate a machine with applications that may be out of date, I’ll install an old version of Firefox on the VM, which can be found here. Let that finish installing, run another credentialled scan and we’ll compare the number of vulnerabilities present.
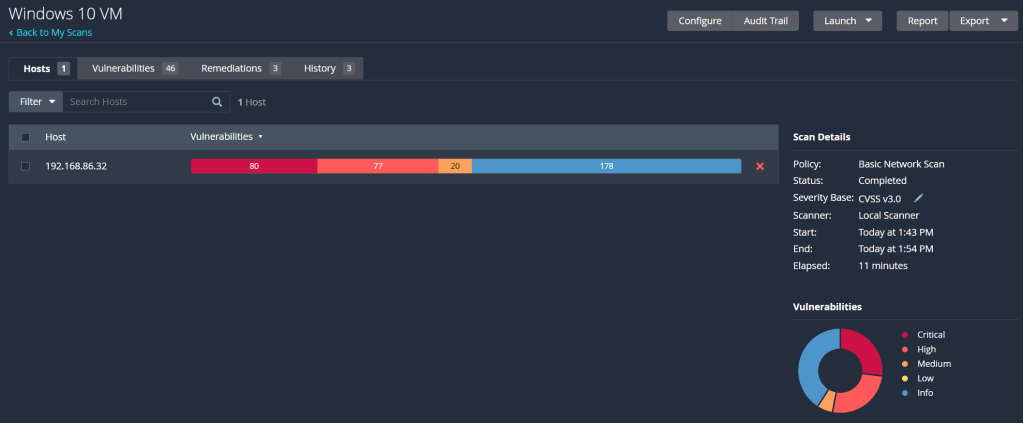
That’s a hell of a lot more red with just one out of date application. More than half of the findings are either critical or high severity vulnerabilities. Diving into the list of vulnerabilities, most of them seem to be concerned with out of date software, requiring different updates to get it up to speed and secure. Obviously, the Firefox version is extremely out of date, but even the operating system is missing updates and patches to some of its software and applications. The best thing to do here is return to the VM and update Firefox to the latest version. I also need to check for the missing Windows updates and apply them to reduce the number of vulnerabilities. After doing so, and working through some of the other vulnerabilities Nessus found, my final scan is looking something like this:
Only the 1 vulnerability! How good! I couldn’t seem to patch the last one following the instructions Nessus provided to patch it, but potentially its due to me disabling the firewall on the VM. Either way, the VM is significantly more secure now compared to its previous, default state. With most of the vulnerabilities being patched downloading and installing updates, this lab has reinforced how important it is to regularly update your systems and applications. Keeping them out of date, even more a seemingly minor update, can leave multiple vulnerabilities present and exploitable.
Like many of the other labs I’ve done so far, this is only scratching the surface with Nessus. Even by looking at the list of other types of scans outside a basic network scan demonstrate how powerful and comprehensive this tool can be. I can say I’ve got a good understanding of the basics however, and that’s a good place to start as I explore the field of vulnerability management. I’m sure the process of scanning and remediating vulnerabilities in a large organisation would be very different to me just scanning a VM, so learning about that is my next step. Till then, I hope you all enjoyed following along with me!