Nmap: Not so -sStealthy after all

Nmap is one of the most commonly used network enumeration tools used in the cybersecurity landscape.  Through various methods, it allows users to perform host discovery, port scanning, and gain key insights about the devices that are being scanned.  The utility the program offers makes it indispensable from a cybersecurity professional toolkit, but the same could be said for malicious actors as well.  Often, nmap is used by them to find a way into a network, or discover what is inside a network once they’ve gained access.  This fact makes it essential for cybersecurity professionals to understand the nuts and bolts of how nmap scans work, and how to detect them.

The most commonly used nmap scan is a SYN scan.  Denoted by the -sS option flag, this scan is used to identify the status of ports on a machine.  Open ports can act as entry points to a system, so identifying them is a must for both red and blue teamers alike.  An example of this scan can be seen below:

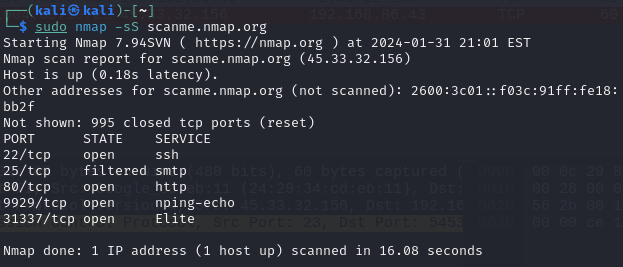
Here, we are performing a SYN scan against scanme.nmap.org to determine which ports it has open.  The way nmap does this is by sending out a SYN packet to each of the top 1000 most commonly used ports on our target device.  If the port is open, closed, or being filtered by something like a firewall, we will get a different response.  The scan above shows that out of 1000 ports, 4 are opened and 1 is being filtered.  To understand just how nmap is able to determine the status of all these ports, we can boot up wireshark and analyse what exactly is happening. 

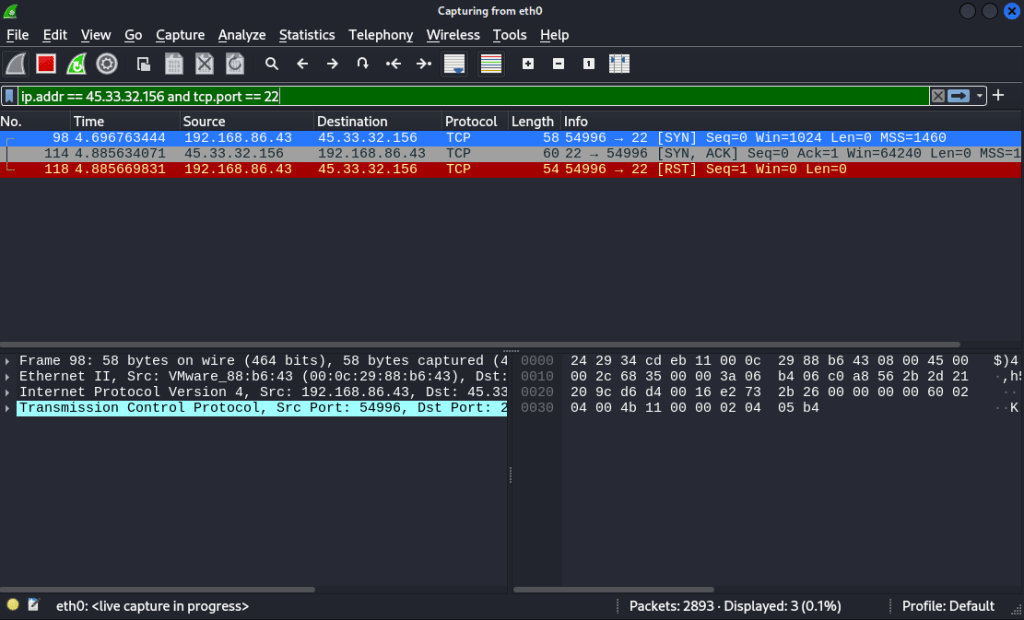
In this image, we’re using wireshark to filter for activity on port 22 of our target, one of the ports we know is open.   Once our SYN packet of our scan is received by our target on port 22, it sends back a SYN/ACK packet, indicating that they are ready to initiate a TCP connection over this port.  Since the target machine was willing to have a connection be established over this port, nmap understands it to be open.  Once our device receives this, it immediately sends a RST packet back.  This type of scan does not complete the TCP handshake, so once the SYN/ACK is received, nmap has all the information it needs and the connection can be terminated.

Alternatively, if the port is closed, we see a different packet conversation between our machine and the target:

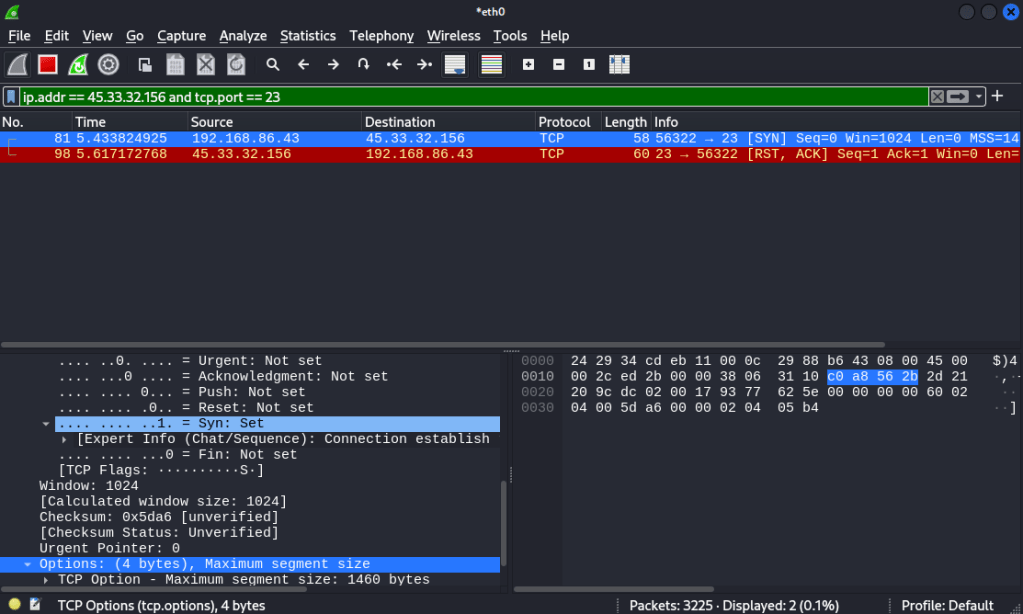
Nmap determined port 23 as closed, so when we change our filter in wireshark to investigate traffic going to port 23 on that device, we can see why.  The initial SYN packet is simply met with a RST/ACK packet from the target, indicating the port is closed.  No further data can be transmitted to that port, since the target device will not accept connections on it.

Understanding how the SYN scan works on a packet level allows us to appreciate why it has come to be known as the stealth scan.  It does not create a full TCP connection with the device’s open port, simply leaving the connection half-open.  By not completing the TCP handshake, the device may not log the scan as there was no connection made.  

However, many modern intrusion detection systems and firewalls are well equipped to detect SYN scans like this, so the stealth scan title isn’t as applicable in modern times.  Even equipped with a packet analysis tool like wireshark, SYN scans can be identified quite easily if you know what to look for.  

This is where our mentality shifts to a blue team mindset, aiming to identify if a scan is taking place against our network or devices.  By delving into the details of the initial SYN packets sent by nmap, we can identify some key pieces of data that help us to identify if someone is performing a basic SYN scan against our devices.  The pieces of data are the window size and the options field, which then in turn impacts the header length of the packet.  All this is highlighted in yellow below:

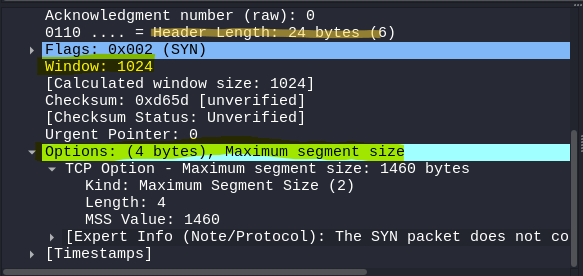
Compared to regular network traffic that happens between devices, these fields are considerably abnormal.  Try see how they compare to a SYN packet that was sent when I connected to google.com

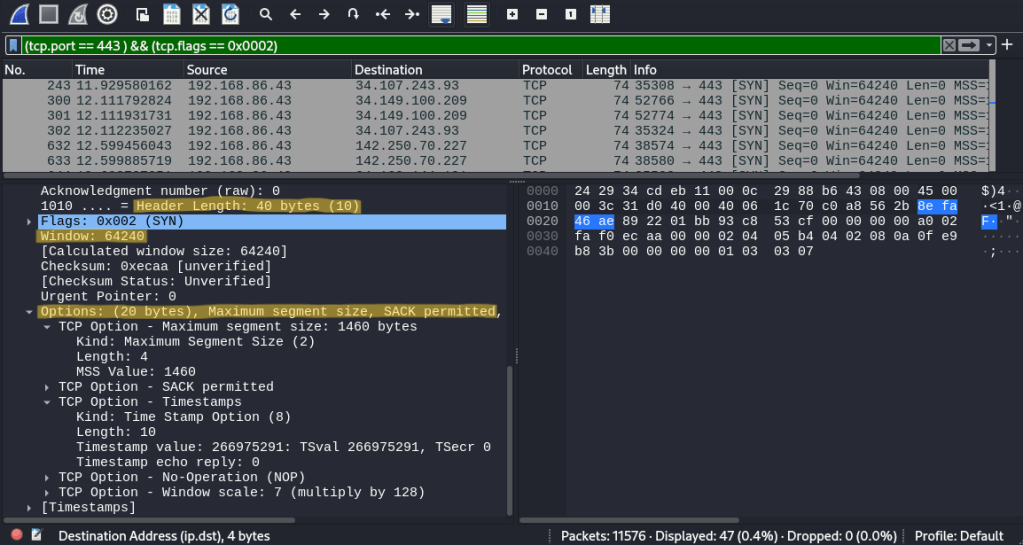
Observing the two packets side by side really makes the SYN packet from nmap stand out as irregular.  The window size from nmap is considerably tiny compared to a legitimate SYN packet, and the lack of options present in nmap’s SYN packet causes the header length to vary by a significant amount of bytes.  These differences occur due to the fact nmap itself is sending out the SYN packets used in its scan.  It is filling the packet with data itself, which makes it noticeably different from regular traffic.  On the other hand, SYN packets used for regular traffic are created by the operating system, which is why they have different fields and values.

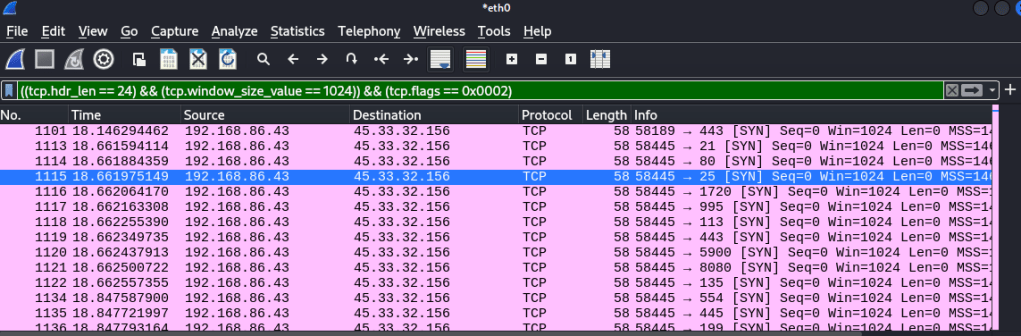
With these differences in mind, we can use this to create a filter in wireshark to catch all the SYN packets sent out by nmap using this scan.  If I was a network administrator and was seeing packets like this being sent out across the network, it would definitely raise the suspicions that someone is scanning the network.  The filter to do so can be seen below, which is solely catching SYN packets sent out by nmap.

However, while this may catch someone running a basic SYN scan, malicious actors are always capable of creating new ways of bypassing detection.  They could use a different scan that flies under the current detection rule, or edit the values in the SYN packet so the header length is different, resulting in bypassing our previously created filtering rule.

While the filtering that we created for these scans may be easy to circumvent, the exercise still allows for a great opportunity to learn how exactly nmap functions below the surface.  In general, understanding how things work from a packet level is a great way to build understanding, and create solid foundations that will serve you well as you continue to explore and investigate new and exciting things in the field.  I encourage everyone with an interest in cybersecurity to play around with tools like nmap and wireshark just like this, as getting down into the nitty gritty of how exactly they work is the perfect way to build up that important knowledge base and avoid being just another script kiddie.

Book Review: The Art of Deception by Kevin Mitnick

Kevin Mitnick’s ‘The Art of Deception’ is a deep dive into the world of social engineering, far beyond the clumsy phishing attempts filling our inboxes. Before picking up this book, my idea of a social engineer was pretty one-dimensional — malicious actors crafting phishing emails, or even the one rogue actor who might try sneak into a company building in an obvious way. But Mitnick, one of the most infamous hackers of the 1990s, turns that image on its head. He unpacks the many manipulative tactics that social engineers can use to infiltrate their way into organisations, preying on the weakest link of any security operation – the human element.  Even with the most sophisticated tech in our modern technological age, if the people around us don’t remain vigilant, Mitnick tactfully demonstrates just how easily social engineers can break in undetected.

The Art of Deception | Mitnick Security

Delving into Mitnick’s accounts, I came to understand that cybersecurity isn’t just about the secure technologies we use; it’s about the bigger picture of security.  It encompasses both the digital defences and the human elements that play a crucial role in protecting information, with both being of equal importance.  His stories, while some may hinge on outdated tech like telephone switchboards, are timeless in their lessons. They taught me that vigilance is key and that the most innocuous details can be twisted into a tool for deceit. Information that may seem harmless to you, may be the key a social engineer needs to manipulate his way into your organisation.  Throughout the various anecdotes Mitnick provides, it allowed me to become more cautious and critical of the information I give out and whom I trust — a mindset shift that’s sure to stick with me throughout my career going forward now.

Mitnick’s book shines with its detailed breakdown of social engineering tactics, painting a vivid picture from both the perpetrator’s and the victim’s perspectives. Each chapter follows a similar style that presents each social engineering tactic in an engaging way.  Mitnick fills each chapter with multiple vignettes of each ‘con’, exploring its execution from the victim and social engineer’s point of view, before analysing its execution and prevention.  Providing both the perspectives of the social engineer and the victim really cements the realism of each story, which allowed me to really grasp just how easily an attack like this could occur unnoticed.  Each chapter is rich with detail, and Mitnick follows this up by providing a comprehensive list of security policies and measures to combat all the different attacks he explores throughout the book.  Despite being written for a different technological era, this section may provide the best value for many people as Mitnick clearly was extremely thorough in his suite of recommendations. 

While Mitnick’s work is rich in detail, I found that many of the chapters tended to slightly overstay their welcome. The later chapters start to blend into each other, and cutting down on some of the repetition could make the key points stand out more.  Reducing some chapters by even one or two anecdotes would go a long way to streamlining the reading experience whilst making the key points stand out more. The lack of variety in the style of the chapters also slightly hampered my enjoyment as I read through the book, and may cause some reader’s engagement to wane.  Each story within each chapter was still rich with information, but after you finish the first chapter, you soon find out the rest of the book is structured exactly the same.  I would’ve liked to see some more variety in how the information is presented throughout the book, which I believe would have made the readability more enjoyable and less repetitive.

Overall, ‘The Art of Deception’ still holds up in the fast-paced world of cybersecurity as an impressively informative read decades on from its release. Mitnick’s expertise and prior experience allows him to offer a treasure trove of insights into the minds of social engineers, making it an enlightening read for anyone wishing to expand their defensive knowledge. Even with some sections that could use tightening up, the book’s core messages and the learnings it provides are both clear and powerful. I’d recommend it to anyone who wants to up their security game, if you’re willing to look past the dated technology and focus on the key aspects pertaining to the vulnerabilities of the human psychology.  If you can, I know you’ll find it to be a real eye-opener and a guide that could very well save you from becoming another cautionary tale.

Nessus and Chill: First Hands on with Nessus Essentials

One of the tools I’ve heard mentioned a lot in cybersecurity spaces, particularly when it comes to vulnerability management is Nessus.  Nessus is a vulnerability scanner, with Nessus Essentials being their free version.  It scans systems, networks, and applications to help organisations identify vulnerabilities that pose potential security risks.  It’s widely used by businesses and cybersecurity professionals to ensure the security and compliance of their IT infrastructure.  It’s a powerful tool, and something I’m keen to get some experience with.  This tutorial I found by Josh Madakor is a perfect start, guiding viewers through a beginner level lab to using Nessus and facilitating that first hands on experience with the tool.  That is what I’m going to be working through today in this post, so follow along and hope you enjoy hearing about how I went about it.

To get started, we’re going to need to download Nessus Essentials.  This can be done through their website, linked here.  Simple register for an activation code, follow along and it’ll download.  Nessus runs on our own local machine using port 8834 by default, so we connect to the web interface by going to the URL https://localhost:8834.  Simply select Nessus Essentials, punch in the activation code and it’ll download and compile the required plug-ins.  We’ll be running our scans on a basic Windows 10 Virtual Machine, the ISO file for which can be found at Microsoft’s website here.  I’ll be running this VM on VMware Workstation, but any alternative such as VirtualBox will do the trick as well.  Download the file and create a new VM with it.  We’ll be using the Windows 10 Pro operating system in this lab.

Once the VM is all set up, the first thing we’ll want to do is get the IPv4 address of the machine.  We use this address to connect to the VM through Nessus Essentials that’s running on our machine.  This can be done by opening the command line and typing the command ‘ipconfig’, like so:

We can then ping that IP address on our PC to make sure we can reach the VM.  We do this by running the command ‘ping <IPv4 address>’ on the command line.  Adding the ‘-t’ flag will continue to ping the machine until we cancel it, which may be useful as our PC is most likely not going to be able to detect the VM on the first go, as the ping requests will time out.  To fix this, we can just disable the firewall on the VM.  When working with a proper host, this is not ideal and creates unnecessary risk.  However,  we’re only using this VM for this simple lab, so we don’t mind as much if we turn the firewall off.  To do so, we follow the same process I did in my previous post linked here, turning the firewall state of the domain, private and public profiles off.

Even after disabling the firewall, I continued to not be able to ping the VM from my PC.  I figured out that this was because my VM was configured to use a NAT network connection, which shared the host’s IP address.  This was causing me to be unable to ping the machine, as it was on the LAN on the host.  Switching the network connection to a bridged connection allowed the VM to get its own IP within the network, and made it discoverable by my PC.  This can be changes in the Network Adapter tab, under Virtual Machine Settings of VMware

Now that we can access the VM from our PC, we can get to scanning our machine.  Navigate back to our Nessus Essentials web app and create a new scan.  There’s lots of different types of scans that check for a range of vulnerabilities, but we’re only going to be running a Basic Network Scan today.  Click on that one and fill out the details, filling in the targets box with the IPv4 address of the VM.

The first scan we’ll be running is just a basic, non-credentialled scan.  With this kind of scan, Nessus will scan the machine for any obvious vulnerabilities, reporting them back to the user along with any notable bits of information it finds about the VM.  Non-credentialled scans aren’t very thorough though, as they don’t get into the machine and scan places such as the file system and registry, providing a greater assessment of the state of the machine.  After our non-credentialled scan, we’ll revisit the credentials tab to run our own credentialled scan.  In the meantime, we can hit save, then the launch button on the right to get the scan started.

Once completed, we can click on the scan to view its results:

Further clicking on the scan brings up a list of all the reported vulnerabilities and information, as seen below:

So the first scan had a couple vulnerabilities it detected but was mainly full of information about the machine.  Each one of those vulnerabilities can be clicked on and expanded, to see the information reported, as well as an overview of the vulnerability detected and how to patch it.  However, this scan wasn’t extensive enough for my liking, so we’re going to run a credentialed scan to identify vulnerabilities within the VM.

To do so, we need to configure the VM for a credentialled scan. An full walkthrough of enabling a credentialled check on Windows can be found here, which goes into better detail than I can.  Essentially, we enable the remote registry, enable printer and file sharing, and disable user account control.  Then we added a registry entry called LocalAccountTokenFilterPolicy, settings its value to 1.  Once that is all done, reboot the VM, and we can run our credentialled scan.  Return to Nessus, select the scan, and click on configure which is under the more tab in the top right of the screen.  There, we add a new set of windows credentials under the credentials tab, inputting our username and password. 

Save it and we can run the scan one more time.  Once it’s complete, it should be looking something like this:

That’s a lot better.  Now we can see that even as a default  Windows 10 machine, there’s multiple vulnerabilities present right off the bat.  To simulate a machine with applications that may be out of date, I’ll install an old version of Firefox on the VM, which can be found here.  Let that finish installing, run another credentialled scan and we’ll compare the number of vulnerabilities present.

That’s a hell of a lot more red with just one out of date application.  More than half of the findings are either critical or high severity vulnerabilities.  Diving into the list of vulnerabilities, most of them seem to be concerned with out of date software, requiring different updates to get it up to speed and secure.  Obviously, the Firefox version is extremely out of date, but even the operating system is missing updates and patches to some of its software and applications.  The best thing to do here is return to the VM and update Firefox to the latest version.  I also need to check for the missing Windows updates and apply them to reduce the number of vulnerabilities.  After doing so, and working through some of the other vulnerabilities Nessus found, my final scan is looking something like this:

Only the 1 vulnerability! How good!  I couldn’t seem to patch the last one following the instructions Nessus provided to patch it, but potentially its due to me disabling the firewall on the VM.  Either way, the VM is significantly more secure now compared to its previous, default state.  With most of the vulnerabilities being patched downloading and installing updates, this lab has reinforced how important it is to regularly update your systems and applications.  Keeping them out of date, even more a seemingly minor update, can leave multiple vulnerabilities present and exploitable.

Like many of the other labs I’ve done so far, this is only scratching the surface with Nessus.  Even by looking at the list of other types of scans outside a basic network scan demonstrate how powerful and comprehensive this tool can be.  I can say I’ve got a good understanding of the basics however, and that’s a good place to start as I explore the field of vulnerability management.  I’m sure the process of scanning and remediating vulnerabilities in a large organisation would be very different to me just scanning a VM, so learning about that is my next step.  Till then, I hope you all enjoyed following along with me!

ginreenignE – StupidCrackMe

Welcome back!  One of the videos as of late that caught my eye was this one by nang, taking a basic look into the world of reverse engineering.  His video inspired me to have a go myself with some basic reverse engineering and to have a crack at some of the challenges available for download at crackmes.one. This website hosts a variety of downloadable reverse engineering challenged, with varying levels of complexity.  In this post today, I’m outlining the steps I took to complete my very first CrackMe, Funny_Gopher’s StupidCrackMe, a basic CrackMe that’s linked here

The tools I used were VirusTotal to scan the executable for malware and Ghidra as the software reverse engineering suite. This was one of the recommended pieces of software I use for reverse engineering, allowing me to decompile and disassemble the CrackMe executable and figure out what’s going on under the hood. I only have a basic understanding of the software for now, but it does look very powerful.

First step is to run the CrackMe and see what kind of problem we’re dealing with. Upon running, it’s a guess the password type problem, which returns the following when the wrong password is guessed.

Hmm, not much I can do here besides brute force my way in, time to load the executable into a new Ghidra project, analyse it and then playing around with its decompiled form. Having a scroll through does make the program seem quite confusing, but the most important thing I’ve found in Ghidra is being able to understand and extract the information most important to you. Since the program is written in C/C++, it will have some kind of main() function, acting as the entry point for the program. This can be found under the ‘Functions’ folder, in the ‘Symbol Tree’ window on the left.

On first look, there doesn’t seem to be a main function, rather just an entry function. This appears to be the start point for the program, and the main body of the program would be further hidden within the function calls. That would involve looking through both the functions specified on the right in the decompile window to try find it however, which doesn’t seem efficient.

Instead, we can leverage the information we already know about the program to hopefully help us find some information about the password. This would be the strings the program is printing out. We can see that when run, the program is printing strings such as “Find Password.” and “Oyh man! Very bad, password not found.” into the terminal, so by looking for these strings, we can find out how and where they’re being used. Using string search with the filter of “Password” does just this, highlighting where in memory these strings are assigned!

Double clicking on any of these strings takes us to the function where these strings are being used, which luckily for us contains some really great information about what the password is.

Looking at the decompiled code, we can see that the program is getting the password we’re inputting with get(), then comparing it to the actual password with strcmp(). Since our password is being stored in the acStack_10 variable, that must mean the actual password is stored within the first variable of the string compare function. Double clicking on it takes us to the memory address of the variable, showing the value to be “LiL2281337”.

Running the program once again with that gives us…

Success! CrackMe complete! Yet is there any way for us to change the program so an incorrect password would be accepted? Not just LiL2281337? We can do this by modifying the assembly code in Ghidra, allowing us to create a patched version. Clicking on the if statement in the decompiled code highlights the associated assembly code in the Listing window in the centre. Currently, the instruction is JNZ, which is a conditional jump when the zero flag – a status flag representing most recent arithmetic or logical expression – is not equal to zero. Simply, it will jump to a different part of the program if the value is not zero, which in this case, is the part of the program indicating the password is incorrect.

The opposite of this instruction is JZ, which does the same function as JNZ, except jumping when the zero flag is equal to 0. Swapping the JNZ instruction to JZ would invert the if statement, making an incorrect password the correct one, and the single correct password the incorrect one. To do so, we right click on the JNZ command and select ‘Patch Instruction’. Editing the JNZ to JZ and hitting enter will invert the if statement, which is reflected in the decompile window on the right.

Easily done, now we just need to export the new patch as a portable executable (PE), save it and give it a try…

Working great! Just like that we’ve reversed engineered the program, so any password we use – besides the original correct one – will be seen as correct and allows us to circumvent the password check.

While this was a simpler CrackMe, it was a good starter in the world of reverse engineering, allowing me to get some good exposure to assembly and decompiler software such as Ghidra. Keen to try some more of these and progressively move up to some more complex ones, so expect to see some more posts about further CrackMes that I complete. Until then!

SIEMple Enough!

In my studies for the CompTIA Security+ exam, I came across the concept of a SIEM, a device capable of combining log data from multiple different sources into a centralised device.  I then came across this tutorial created by Josh Madakor, facilitating hands on experience learning what a SIEM can do.  Having completed the tutorial myself, I was inspired to write about my experience and some of the key takeaways I gained from the project.

The main purpose of this project is to gain exposure working with a SIEM, as well as getting some hands on experience with Microsoft Azure.  Cloud computing has been a booming section of the IT industry, so having a basic knowledge of how to configure and set up different cloud-based applications is an important skill.  Importantly, being able to visually represent where attacks are coming from is very cool, and something that I was excited to see pan out.

The basic idea is to create a virtual machine (VM) with severely reduced defences to act as our honeypot.  Attackers who try to log into the VM will be recorded in the Event Viewer, which contains their IP address.  With the help of a PowerShell script, the IP address will be obtained from these failed log ins and sent to an API which will allow us to create custom logs with geographic data to discover where the attacks are coming from.  These logs will be exported to a Log Analytics Workspace where they can be accessed by Sentinel – Microsoft’s cloud native SIEM – and then analysed, plotting where the attacks are originating from on a global map. Jumping into things, one of the most important considerations when setting up the VM for this project is making sure it’s highly exposed on the internet.  This means disabling all the security protocols and opening all the ports on the machine to make the honeypot extra sweet and noticeable for attackers out on the internet.  One of the main ways we go about doing this is through creating a custom NIC network security group when creating the VM.  This network security group typically determines what network traffic is allowed to and from the VM, but in our case, we create a new inbound rule that essentially allows all traffic from the internet into our machine.  Simply fill in the Destination port ranges field with an asterisk to allow all and our VM is on the way to looking very attractive to attacks now!

Another way we really try to attract attackers to the VM is by disabling the firewalls on the operating system.  This was my first time changing the settings on a firewall, good experience of what not to do.  Simply connect to the VM with a remote desktop, open Windows Defender Firewall with Advanced Security, and change the firewall state to off in the domain, private and public profile.

As all the attackers start to find this machine on the internet and try to log into it, their failed attempts will be logged in the security section of the Event Viewer.  Failed logon attempts are recorded as ‘Audit Failure’, with the event ID of 4625. 

Even when I was first looking at the event viewer and checking it out, there were multiple audit failures present that were from attackers already trying to access the VM.  Highlights just how easy it is to locate exposed machines on the internet when the correct security protocols are turned off.

The Event Viewer collects a lot of information beyond just audit failures.  Luckily, we’re able to use the event ID to extract just the information we need with some PowerShell scripting!  Full credit to Josh Madakor once more, who created this script which is included with his tutorial.  In essence, the script extracts the logs using the event ID, uses this API to gain the locational data of the IP address, then packages them up into a log file containing all the information.  This forms the raw data that we then analyse to figure out where the attackers are trying to access the VM from, a sample of which is seen below.

All these processes have occurred inside the VM so far, but now we turn our attention to our next cloud application, the Log Analytics Workspace.  Log Analytics can collect information from many sources – such as our VM – and run queries on the data to gain insight into the logs.  Custom logs can also be created, which is the function used to understand the raw log data and discover where the attacks are coming from.  Simply connect the workspace to the VM, enter some sample logs and provide the collection path of the log file the script is writing to.  Following that, the workspace can now access our logs!

Being able to read the logs is a completely different story however, because with the log data being in one big text file, our workspace doesn’t know what to make of it.  Queue a bit of machine learning to help the workspace decipher our data.  While it was a bit monotonous to highlight out every field, it was interesting to see the workspace trying to match the same fields in the other log entries.  Training the data set to pick up correct results was simple and really highlighted how quick to learn some algorithms are.

Finally, with our Honeypot attracting attackers and our Log Analytics Workspace ingesting the logs using the PowerShell script, it was time to visualise the data.  This was as simple as creating a new instance of Sentinel and linking it to our workspace, allowing it access to our custom logs.  From there, creating a workbook and writing out a specific query was the final piece we needed.

Run this query, changing the visualisation setting to map, and voila:

The map here shows the attack data from the VM after running for just 12 hours.  As you can see, attacks from Belize were the main contributor, followed by other attacks from South Korea and the United States.  This doesn’t mean the attackers are from these regions however, as proxies and VPNs could’ve been used to protect attacker’s true IP addresses.  The attacks from Belize were especially interesting to see come through into the system.  It was clear some sort of script was being used to try brute force its way into the system, trying common names such as ‘Administrator’, ‘Support’ and ‘itsupport’.  Attacks like this highlight the importance of strong authentication processes, especially when a system has generic account names.

For those interested, I would highly recommend checking out Josh Madakor’s tutorial.  I learnt a lot from the experience, and it was good to put the theoretical learning into practice. I know I’m barely scratching the surface when it comes to SIEMs, logs and other security processes though, and I’m keen to have more of a play with some of the other things this tool can do.  Hopefully you enjoyed just as much as I did.