
In my studies for the CompTIA Security+ exam, I came across the concept of a SIEM, a device capable of combining log data from multiple different sources into a centralised device. I then came across this tutorial created by Josh Madakor, facilitating hands on experience learning what a SIEM can do. Having completed the tutorial myself, I was inspired to write about my experience and some of the key takeaways I gained from the project.
The main purpose of this project is to gain exposure working with a SIEM, as well as getting some hands on experience with Microsoft Azure. Cloud computing has been a booming section of the IT industry, so having a basic knowledge of how to configure and set up different cloud-based applications is an important skill. Importantly, being able to visually represent where attacks are coming from is very cool, and something that I was excited to see pan out.
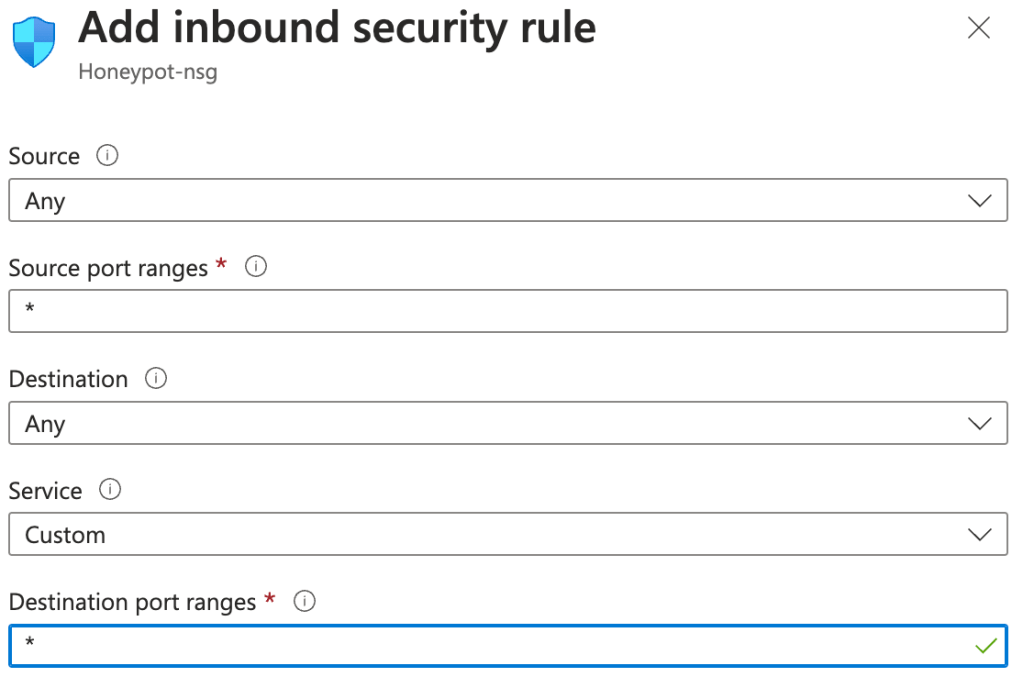
The basic idea is to create a virtual machine (VM) with severely reduced defences to act as our honeypot. Attackers who try to log into the VM will be recorded in the Event Viewer, which contains their IP address. With the help of a PowerShell script, the IP address will be obtained from these failed log ins and sent to an API which will allow us to create custom logs with geographic data to discover where the attacks are coming from. These logs will be exported to a Log Analytics Workspace where they can be accessed by Sentinel – Microsoft’s cloud native SIEM – and then analysed, plotting where the attacks are originating from on a global map. Jumping into things, one of the most important considerations when setting up the VM for this project is making sure it’s highly exposed on the internet. This means disabling all the security protocols and opening all the ports on the machine to make the honeypot extra sweet and noticeable for attackers out on the internet. One of the main ways we go about doing this is through creating a custom NIC network security group when creating the VM. This network security group typically determines what network traffic is allowed to and from the VM, but in our case, we create a new inbound rule that essentially allows all traffic from the internet into our machine. Simply fill in the Destination port ranges field with an asterisk to allow all and our VM is on the way to looking very attractive to attacks now!
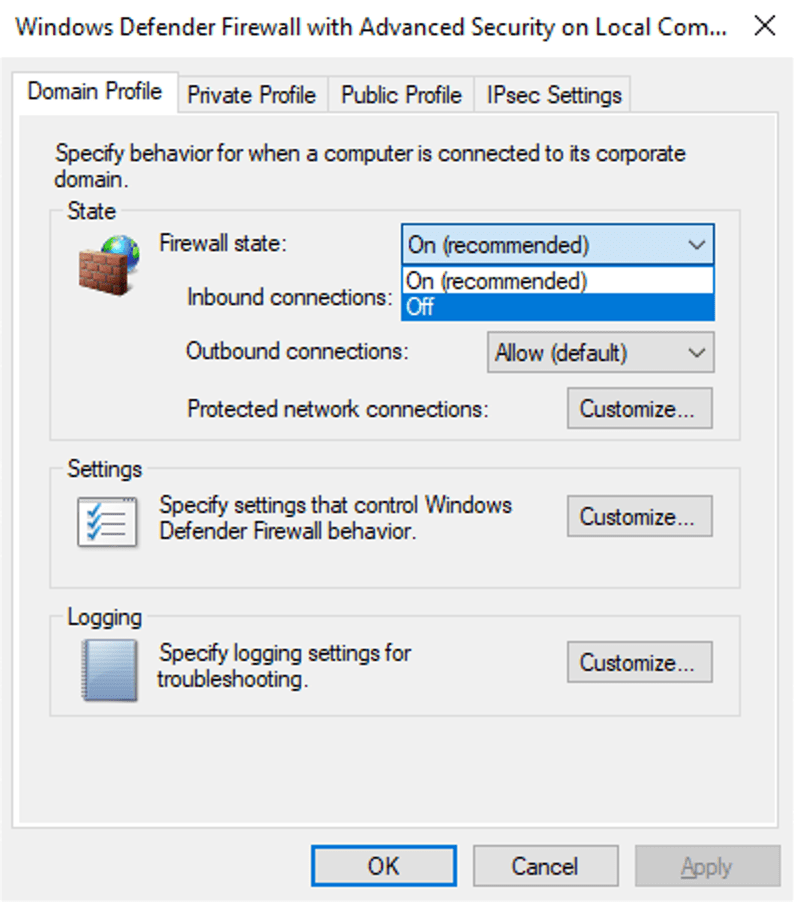
Another way we really try to attract attackers to the VM is by disabling the firewalls on the operating system. This was my first time changing the settings on a firewall, good experience of what not to do. Simply connect to the VM with a remote desktop, open Windows Defender Firewall with Advanced Security, and change the firewall state to off in the domain, private and public profile.
As all the attackers start to find this machine on the internet and try to log into it, their failed attempts will be logged in the security section of the Event Viewer. Failed logon attempts are recorded as ‘Audit Failure’, with the event ID of 4625.
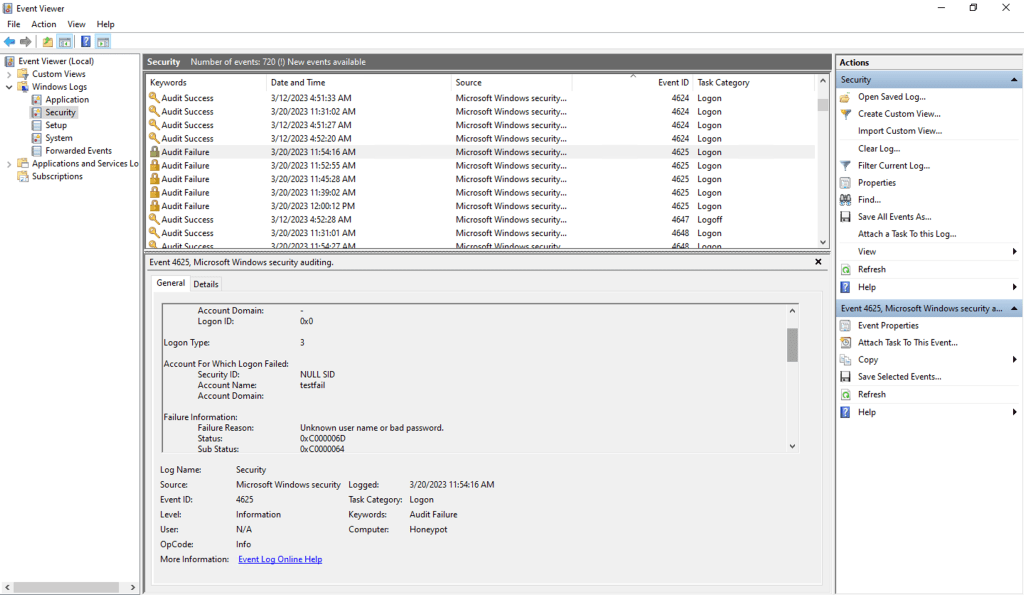
Even when I was first looking at the event viewer and checking it out, there were multiple audit failures present that were from attackers already trying to access the VM. Highlights just how easy it is to locate exposed machines on the internet when the correct security protocols are turned off.
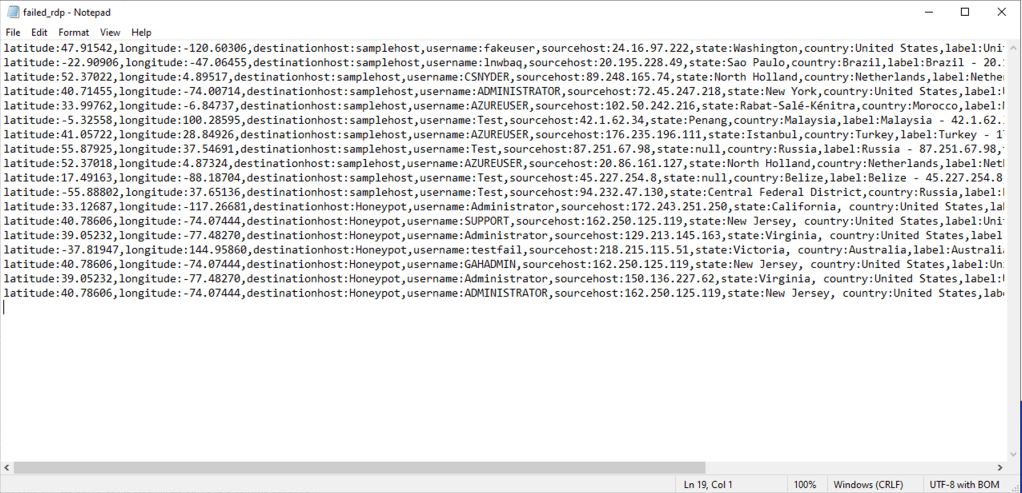
The Event Viewer collects a lot of information beyond just audit failures. Luckily, we’re able to use the event ID to extract just the information we need with some PowerShell scripting! Full credit to Josh Madakor once more, who created this script which is included with his tutorial. In essence, the script extracts the logs using the event ID, uses this API to gain the locational data of the IP address, then packages them up into a log file containing all the information. This forms the raw data that we then analyse to figure out where the attackers are trying to access the VM from, a sample of which is seen below.
All these processes have occurred inside the VM so far, but now we turn our attention to our next cloud application, the Log Analytics Workspace. Log Analytics can collect information from many sources – such as our VM – and run queries on the data to gain insight into the logs. Custom logs can also be created, which is the function used to understand the raw log data and discover where the attacks are coming from. Simply connect the workspace to the VM, enter some sample logs and provide the collection path of the log file the script is writing to. Following that, the workspace can now access our logs!
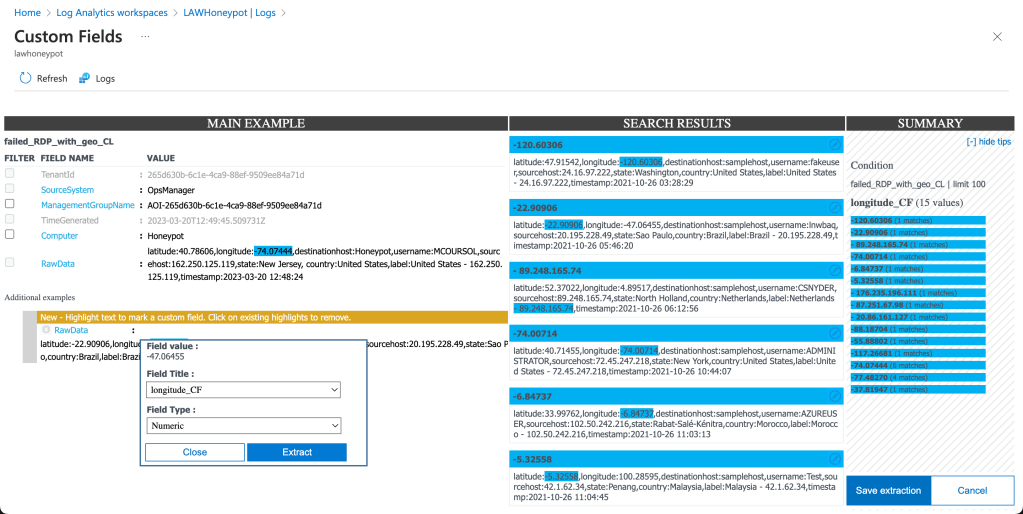
Being able to read the logs is a completely different story however, because with the log data being in one big text file, our workspace doesn’t know what to make of it. Queue a bit of machine learning to help the workspace decipher our data. While it was a bit monotonous to highlight out every field, it was interesting to see the workspace trying to match the same fields in the other log entries. Training the data set to pick up correct results was simple and really highlighted how quick to learn some algorithms are.
Finally, with our Honeypot attracting attackers and our Log Analytics Workspace ingesting the logs using the PowerShell script, it was time to visualise the data. This was as simple as creating a new instance of Sentinel and linking it to our workspace, allowing it access to our custom logs. From there, creating a workbook and writing out a specific query was the final piece we needed.
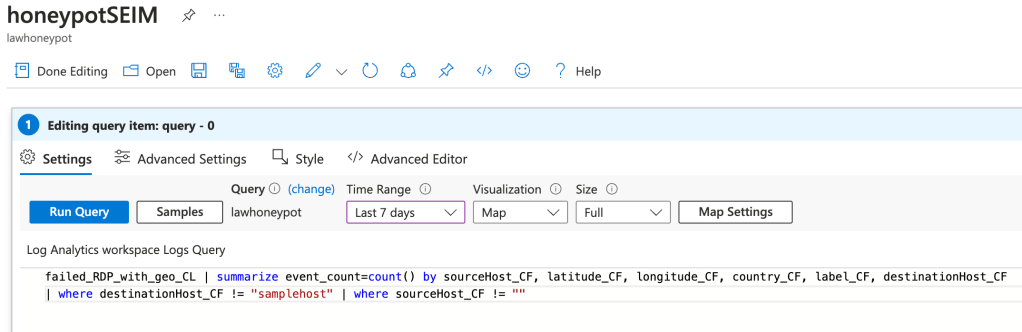
Run this query, changing the visualisation setting to map, and voila:
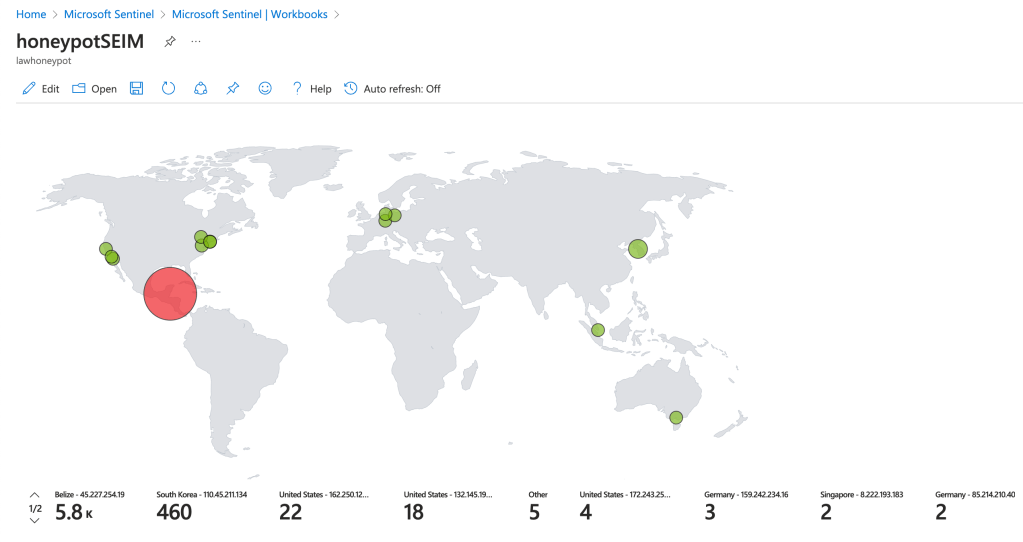
The map here shows the attack data from the VM after running for just 12 hours. As you can see, attacks from Belize were the main contributor, followed by other attacks from South Korea and the United States. This doesn’t mean the attackers are from these regions however, as proxies and VPNs could’ve been used to protect attacker’s true IP addresses. The attacks from Belize were especially interesting to see come through into the system. It was clear some sort of script was being used to try brute force its way into the system, trying common names such as ‘Administrator’, ‘Support’ and ‘itsupport’. Attacks like this highlight the importance of strong authentication processes, especially when a system has generic account names.
For those interested, I would highly recommend checking out Josh Madakor’s tutorial. I learnt a lot from the experience, and it was good to put the theoretical learning into practice. I know I’m barely scratching the surface when it comes to SIEMs, logs and other security processes though, and I’m keen to have more of a play with some of the other things this tool can do. Hopefully you enjoyed just as much as I did.

Pingback: Nessus and Chill: First Hands on with Nessus Essentials | The Last Cyber Bender